Your knowledge of a Gantt chart might be limited— maybe you know they are used to map out project timelines and activities. You may have seen stacked bar charts as well.
If you haven’t delved much deeper than that, don’t worry. In this blog, we will cover what you need to know about Gantt charts as a project management tool and answer your burning questions like, ‘should you be using online Gantt chart software’, ‘build a Gantt chart in Excel or one in Google sheets’ —or stick to pen and paper for project planning?
What is a Gantt chart?
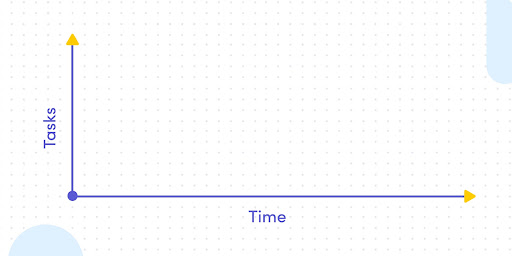
A Gantt chart is a horizontal bar chart that shows a project’s planned schedule and its tasks or events over time. Each bar in the Gantt chart represents a task, while the dates are laid out horizontally.
Gantt charts are commonly used as project schedules because they are one of the most useful and classic ways of showing activities displayed against time. It is based on Henry Gantt’s original design that evolved from Karol Adamiecki’s harmonograph.
Modern Gantt charts can also show task dependencies — how each task connects to others.
What is the purpose of a Gantt chart?
A simple Gantt chart provides clarity on deadlines, milestones, and project progress. Everyone on your team knows what they have to work on, when, and how it impacts the overall project.
What are the four components of a Gantt chart?
While no two Gantt charts look the same, let’s take a closer look at their key components.
- Dates/milestones: The date and duration of each task are often displayed in days/weeks/months, but can also be represented in minutes/hours. The current day/time is usually highlighted. P.S., the length of each rectangle tells you how long a task is expected to take, known as the duration of the task.
- Tasks/items: There are individual activities (or tasks) that live at various stages of completion. Each task can stand on its own, and if you use staging-mondaycomblog.kinsta.cloud you can also group tasks together to create sub-items.
- Owner: This represents the person responsible for the task. Note: this can be more than one person or an entire team.
- Bars & columns: Bars are what communicate a task’s duration, while columns are the actual dates.

It’s easy to create a Gantt chart to your work on staging-mondaycomblog.kinsta.cloud — we have a dedicated view for it. Try it now!
Get startedWhat is a Gantt chart used for?

A Gantt chart is primarily used to assist the planning and scheduling of projects of all sizes, but they are particularly useful for simplifying complex projects and their KPIs. Project management with Gantt charts could include anything from resource management plans to planning killer marketing campaigns.
Understanding a project’s scope and requirements is made easier with Gantt charts because they provide a visual representation of your project at any stage, including task dependencies, priorities, and ownership. This can also be useful as a high-level guide for managers as they are tracking project progress.
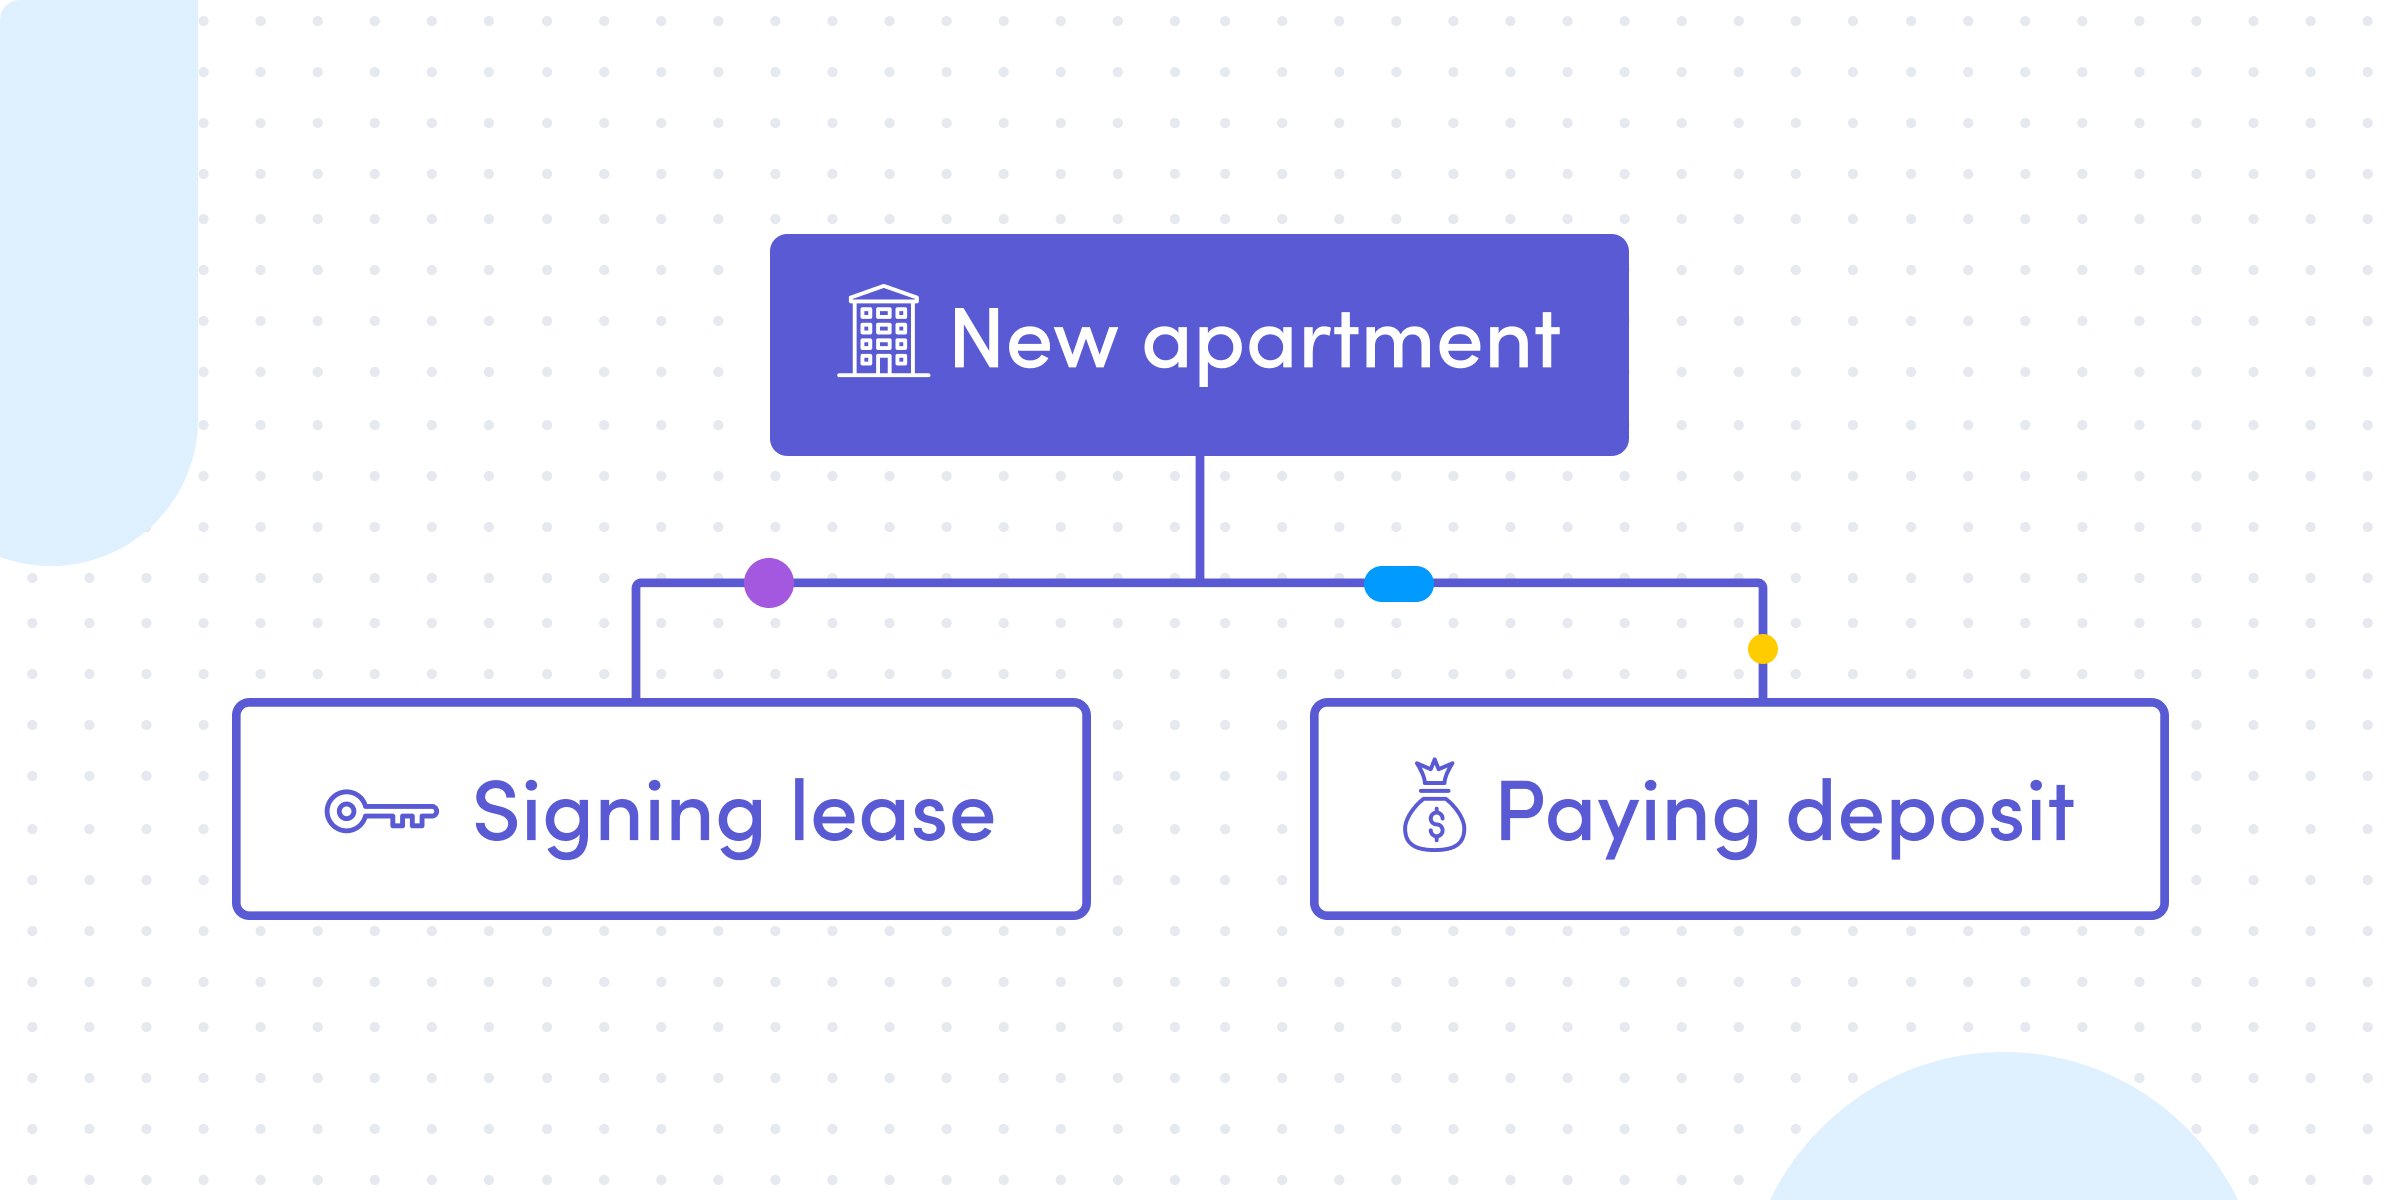
This relates to Work Breakdown Structure of WBS, a specific method of breaking down large or complicated goals into manageable objectives. It is often the foundation for creating a solid Gantt chart. It depicts what tasks (and subtasks) are to be completed, but it does not show when each task will begin and end. By starting with a hierarchical representation of tasks and their dependencies (WBS), you can then layer in Gantt chart components such as time, ownership, status, milestones, etc. to create a clearer picture.

What is the critical path in Gantt charts?
Any explanation of Gantt chart structure should also include something called a critical path. A critical path refers to the phenomenon in which any individual task could cause a delay in a related sequence of tasks, therefore pushing back a project’s overall end date.
The critical path method is an approach used by project managers to determine the longest sequence of tasks that must be completed for the project to be a success. Gantt charts allow you to quickly visualize which tasks are auxiliary, which are most critical, and which of all tasks are most vital to the delivery of a project happening on time. Once you know a project’s critical path, you’ll be able to set some deadlines for each individual task.
What to look for in Gantt chart software — must-have features
Before we cover how to create a Gantt chart—online that is—we first need to address what to look for in a Gantt chart tool. All of the features we mention are included with staging-mondaycomblog.kinsta.cloud Work OS.
There are many platforms out there that offer only the ability to create a Gantt chart or just provide you with ways to configure a Gantt chart. With staging-mondaycomblog.kinsta.cloud Work OS, you have access to more dynamic features that enhance your Gantt chart on top of an already robust platform:
- Drag and drop: Drag and drop events on the horizontal and vertical axis as things change instead of having to start from scratch—it saves you time and the flexibility makes it work for any team.
- Multiple assignees: staging-mondaycomblog.kinsta.cloud’s Gantt Chart view also allows you to focus on people, not just tasks, by assigning entire teams to them.
- Statuses: The status represents what stage each task currently resides in and can be customized as well.
- Milestones: Indicate the overarching tasks that don’t have a specific duration, and generally mark the end of a certain part of a project.
- Vertical line marker: Our vertical line moves with you and makes it easy to see exactly where you are in the project between the start and end date.
- Dependencies: Indicate which tasks cannot start until another task is completed.

How to easily create a Gantt chart on staging-mondaycomblog.kinsta.cloud
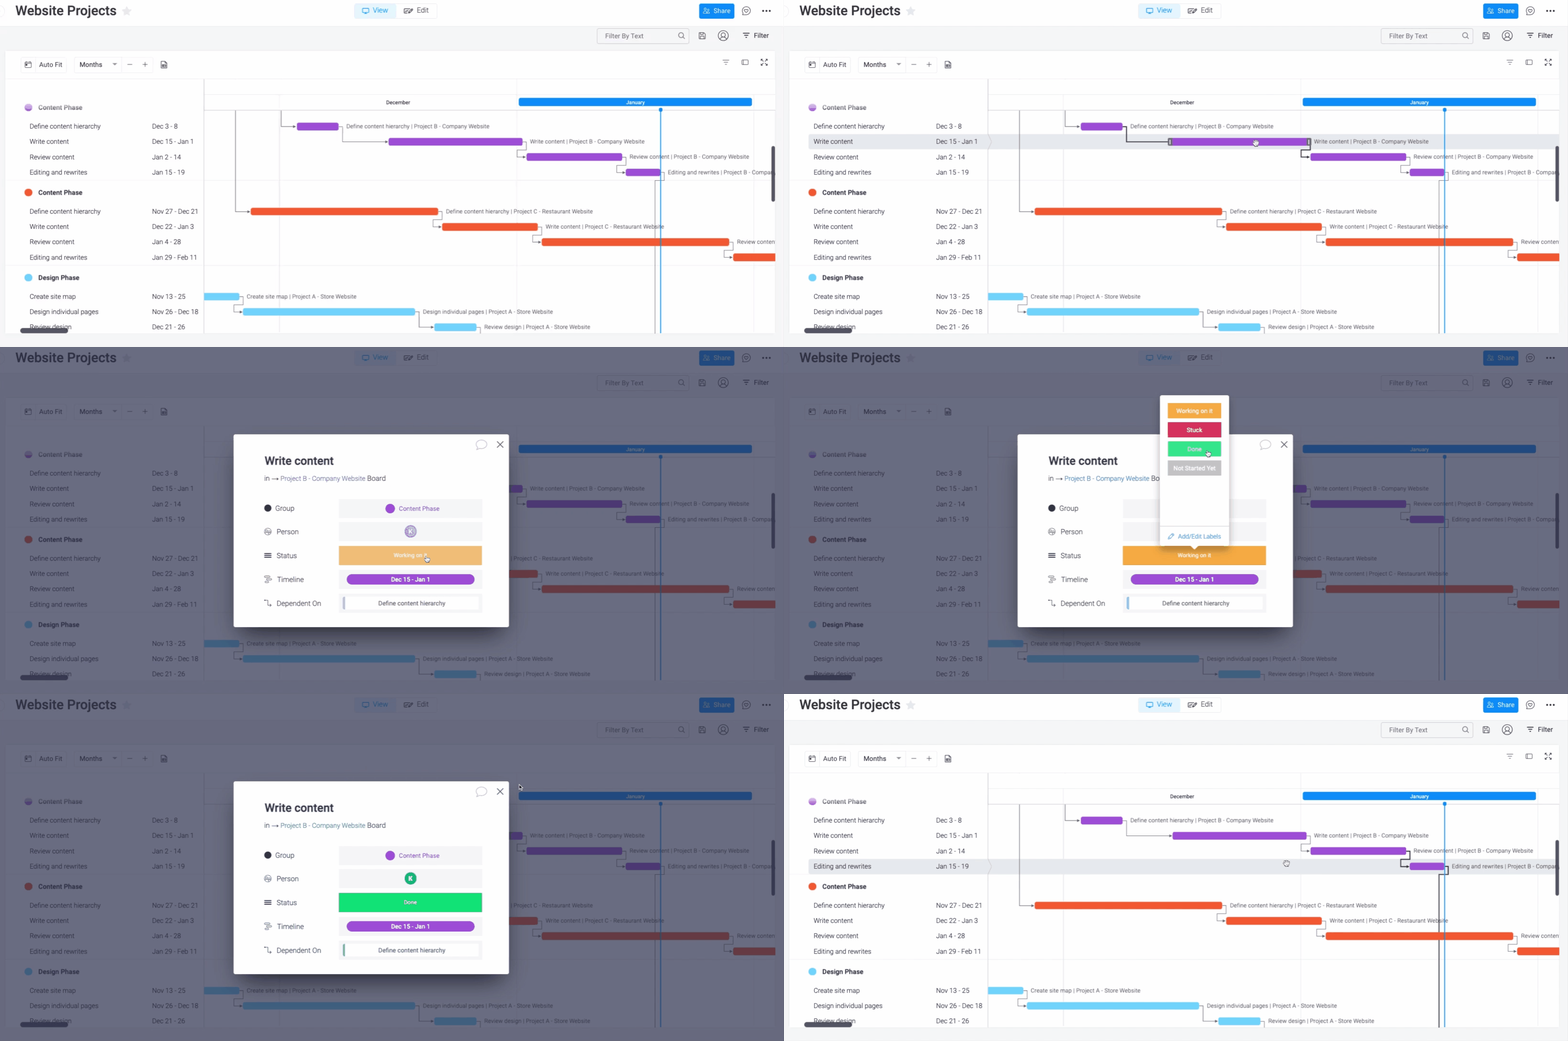
It really requires about three simple steps to create a Gantt chart with our Work OS:
- Make sure your board has a Timeline Column and Dependency Column.
- Select Add View, the Gantt
- Et voila! Your tasks are now organized in one Gantt chart and you can get more creative with on-the-fly edits and cool features like Baseline.
For a detailed walkthrough on how to create a Gantt chart or any of our features, you can visit our Knowledge Center.
FAQs
Still curious for more information about the world of Gantt charts? Here are a few top questions — answered.
How do you make a Gantt chart in Excel?
To show task progress, you can create a Gantt chart in Excel:
- Selecting the data you want
- Click insert, add a bar chart, then select “stacked bar chart”.
- You then have to format the stacked bar chart in order to get the Gantt style.
The easier option would be to opt for a software like staging-mondaycomblog.kinsta.cloud, which has it’s own Gantt View that you can add to any of your boards.
When should a Gantt chart be used?
Gantt charts are a good choice for planning and scheduling projects that are not short-term. You can use a Gantt chart to map out how long a project will take, evaluate resources needed, and the order of tasks, including any dependencies.
Is a Gantt chart a timeline?
While used for similar functions, the main difference between the two is that a timeline organizes events in a single line and a Gantt chart is two-dimensional and includes details like dependencies. However, they both provide stakeholders with high-level overviews of start and end dates and key milestones in a project.
Get startedStart creating your Gantt chart
To wrap things up, you can see that Gantt charts present a useful way to visualize projects, and with the advent of Gantt chart software, they can take your team’s processes to the next level. But not all software solutions are created equal.
The most sophisticated solutions—like staging-mondaycomblog.kinsta.cloud offer advanced features like different chart views, customizable automations and integrations, and the ability to filter the information you included. Check out how we improved Gantt charts for our customers!
So if you are looking for a visual solution that can manage projects of all sizes and industries plus a robust Gantt chart, try out our Advanced Single Project Template.
{
“@context”: “https://schema.org/”,
“@type”: “Product”,
“name”: “Gantt charts explained”,
“brand”: “Monday”,
“description”: “Wondering if Gantt charts are the way to go? Get all your questions answered here and learn how you can create your own Gantt chart on staging-mondaycomblog.kinsta.cloud.”,
“aggregateRating”: {
“@type”: “AggregateRating”,
“ratingValue”: “4.9”,
“bestRating”: 5,
“worstRating”: 1,
“reviewCount”: “952”
}
}
Curious as to what customers are saying about us? See reviews.
FAQ test test
question 1
answer answer answer answer answer answer answer answer answer answer answer answer answer answer answer answer
question 2
answer answer answer answer answer answer answer answer answer answer answer answer answer answer answer answer
question 3
answer answer answer answer answer answer answer answer answer answer answer answer answer answer answer answer